Hurricane Michael
06 Jul 2020
Hurricane Michael was a very powerful and destructive tropical cyclone that became the first Category 5 hurricane to strike the contiguous United States since Andrew in 1992. In addition, it was the third-most intense Atlantic hurricane to make landfall in the contiguous United States in terms of pressure, behind the 1935 Labor Day hurricane and Hurricane Camille in 1969. It was the first Category 5 hurricane on record to impact the Florida Panhandle, the fourth-strongest landfalling hurricane in the contiguous United States, in terms of wind speed, and was the most intense hurricane on record to strike the United States in the month of October.
In this post we will use the data for Hurricane Michael along with the json data for US map to trace out the trajectory of the hurricane as it traverses the contiguous United States. The contiguous United States or officially the conterminous United States consists of the 48 adjoining U.S. states (plus the District of Columbia) on the continent of North America. The terms exclude the non-contiguous states of Alaska and Hawaii, and all other off-shore insular areas, such as American Samoa, U.S. Virgin Islands, Northern Mariana Islands, Guam and Puerto Rico. Therefore using the geopandas library, we will turn the latitude and longitude columns into a geographical Point data type then make a geodataframe. On top of this we plot the path of Hurricane Michael onto the US map in the GeoJSON file.
Note
-
After loading the US_states(5m).json file as a geodataframe, we will use the following code to create a geodataframe that only contains the contiguous United States (48 states):
python map48 = map_df.loc[map_df['NAME'].isin(['Alaska', 'Hawaii', 'Puerto Rico']) == False] -
The longitude column data should be turned into negative values(data source listed longitude direction instead of positive/negative). Use the following code to make the data correct:
python
df['Long'] = 0 - df['Long']
import pandas as pd
import geopandas as gpd #used for transforming geolocation data
import matplotlib.pyplot as plt

from datetime import datetime  #to convert data to datetime that does not fall within the pandas.to_datetime function timeframe
from shapely.geometry import Point  #transform latitude/longitude to geo-coordinate data
from geopandas.tools import geocode #get the latitude/longitude for a given address
from geopandas.tools import reverse_geocode  #get the address for a location using latitude/longitude

%matplotlib inline
Geocoding and Reverse Geocoding
Geocoding is taking an address for a location and returning its latitudinal and longitudinal coordinates. Reverse geocoding would then be the opposite - taking the latitudinal and longitudinal coordinates for a location and returning the physical address.
#load hurricane data collected
hurricane_df = pd.read_csv("datasets/hurricaneMichael.csv")
hurricane_df.head()
| AdvisoryNumber | Date | Lat | Long | Wind | Pres | Movement | Type | Name | Received | Forecaster | |
|---|---|---|---|---|---|---|---|---|---|---|---|
| 0 | 1 | 10/06/2018 17:00 | 18.0 | 86.6 | 30 | 1006 | NW at 6 MPH (325 deg) | Potential Tropical Cyclone | Fourteen | 10/06/2018 16:50 | Beven |
| 1 | 1A | 10/06/2018 20:00 | 18.3 | 86.6 | 30 | 1004 | N at 6 MPH (360 deg) | Potential Tropical Cyclone | Fourteen | 10/06/2018 19:32 | Avila |
| 2 | 2 | 10/06/2018 23:00 | 18.8 | 86.6 | 30 | 1004 | N at 7 MPH (360 deg) | Potential Tropical Cyclone | Fourteen | 10/06/2018 22:38 | Avila |
| 3 | 2A | 10/07/2018 02:00 | 18.4 | 87.1 | 35 | 1004 | NW at 5 MPH (320 deg) | Potential Tropical Cyclone | Fourteen | 10/07/2018 01:38 | Berg |
| 4 | 3 | 10/07/2018 05:00 | 18.6 | 86.9 | 35 | 1004 | NNW at 3 MPH (340 deg) | Tropical Depression | FOURTEEN | 10/07/2018 04:53 | Berg |
hurricane_df['Long'] = 0 - hurricane_df['Long']
#data type of each column
hurricane_df.dtypes
AdvisoryNumber     object
Date               object
Lat               float64
Long              float64
Wind                int64
Pres                int64
Movement           object
Type               object
Name               object
Received           object
Forecaster         object
dtype: object
len(hurricane_df)
45
#see columns with null values
hurricane_df.count()
AdvisoryNumber    45
Date              45
Lat               45
Long              45
Wind              45
Pres              45
Movement          45
Type              45
Name              45
Received          45
Forecaster        45
dtype: int64
#make a new column to hold the longitude & latitude as a list
hurricane_df['coordinates'] = list(hurricane_df[['Long', 'Lat']].values)
#see new coordinates column
hurricane_df.head()
| AdvisoryNumber | Date | Lat | Long | Wind | Pres | Movement | Type | Name | Received | Forecaster | coordinates | |
|---|---|---|---|---|---|---|---|---|---|---|---|---|
| 0 | 1 | 10/06/2018 17:00 | 18.0 | -86.6 | 30 | 1006 | NW at 6 MPH (325 deg) | Potential Tropical Cyclone | Fourteen | 10/06/2018 16:50 | Beven | [-86.6, 18.0] |
| 1 | 1A | 10/06/2018 20:00 | 18.3 | -86.6 | 30 | 1004 | N at 6 MPH (360 deg) | Potential Tropical Cyclone | Fourteen | 10/06/2018 19:32 | Avila | [-86.6, 18.3] |
| 2 | 2 | 10/06/2018 23:00 | 18.8 | -86.6 | 30 | 1004 | N at 7 MPH (360 deg) | Potential Tropical Cyclone | Fourteen | 10/06/2018 22:38 | Avila | [-86.6, 18.8] |
| 3 | 2A | 10/07/2018 02:00 | 18.4 | -87.1 | 35 | 1004 | NW at 5 MPH (320 deg) | Potential Tropical Cyclone | Fourteen | 10/07/2018 01:38 | Berg | [-87.1, 18.4] |
| 4 | 3 | 10/07/2018 05:00 | 18.6 | -86.9 | 35 | 1004 | NNW at 3 MPH (340 deg) | Tropical Depression | FOURTEEN | 10/07/2018 04:53 | Berg | [-86.9, 18.6] |
#list values in coordinates column is classified as object type
hurricane_df['coordinates'].dtypes
dtype('O')
#convert the coordinates to a geolocation type
hurricane_df['coordinates'] = hurricane_df['coordinates'].apply(Point)
#coordinates column now has POINT next to each coordinate pair value
hurricane_df.head()
| AdvisoryNumber | Date | Lat | Long | Wind | Pres | Movement | Type | Name | Received | Forecaster | coordinates | |
|---|---|---|---|---|---|---|---|---|---|---|---|---|
| 0 | 1 | 10/06/2018 17:00 | 18.0 | -86.6 | 30 | 1006 | NW at 6 MPH (325 deg) | Potential Tropical Cyclone | Fourteen | 10/06/2018 16:50 | Beven | POINT (-86.59999999999999 18) |
| 1 | 1A | 10/06/2018 20:00 | 18.3 | -86.6 | 30 | 1004 | N at 6 MPH (360 deg) | Potential Tropical Cyclone | Fourteen | 10/06/2018 19:32 | Avila | POINT (-86.59999999999999 18.3) |
| 2 | 2 | 10/06/2018 23:00 | 18.8 | -86.6 | 30 | 1004 | N at 7 MPH (360 deg) | Potential Tropical Cyclone | Fourteen | 10/06/2018 22:38 | Avila | POINT (-86.59999999999999 18.8) |
| 3 | 2A | 10/07/2018 02:00 | 18.4 | -87.1 | 35 | 1004 | NW at 5 MPH (320 deg) | Potential Tropical Cyclone | Fourteen | 10/07/2018 01:38 | Berg | POINT (-87.09999999999999 18.4) |
| 4 | 3 | 10/07/2018 05:00 | 18.6 | -86.9 | 35 | 1004 | NNW at 3 MPH (340 deg) | Tropical Depression | FOURTEEN | 10/07/2018 04:53 | Berg | POINT (-86.90000000000001 18.6) |
#coordinates column with geolocation data is just a regular pandas Series type
type(hurricane_df['coordinates'])
pandas.core.series.Series
#create a geolocation dataframe type using the coordinates column as the geolocation data
geo_hurricane = gpd.GeoDataFrame(hurricane_df, geometry='coordinates')
#geo-dataframe looks the same as regular dataframe
geo_hurricane.head()
| AdvisoryNumber | Date | Lat | Long | Wind | Pres | Movement | Type | Name | Received | Forecaster | coordinates | |
|---|---|---|---|---|---|---|---|---|---|---|---|---|
| 0 | 1 | 10/06/2018 17:00 | 18.0 | -86.6 | 30 | 1006 | NW at 6 MPH (325 deg) | Potential Tropical Cyclone | Fourteen | 10/06/2018 16:50 | Beven | POINT (-86.60000 18.00000) |
| 1 | 1A | 10/06/2018 20:00 | 18.3 | -86.6 | 30 | 1004 | N at 6 MPH (360 deg) | Potential Tropical Cyclone | Fourteen | 10/06/2018 19:32 | Avila | POINT (-86.60000 18.30000) |
| 2 | 2 | 10/06/2018 23:00 | 18.8 | -86.6 | 30 | 1004 | N at 7 MPH (360 deg) | Potential Tropical Cyclone | Fourteen | 10/06/2018 22:38 | Avila | POINT (-86.60000 18.80000) |
| 3 | 2A | 10/07/2018 02:00 | 18.4 | -87.1 | 35 | 1004 | NW at 5 MPH (320 deg) | Potential Tropical Cyclone | Fourteen | 10/07/2018 01:38 | Berg | POINT (-87.10000 18.40000) |
| 4 | 3 | 10/07/2018 05:00 | 18.6 | -86.9 | 35 | 1004 | NNW at 3 MPH (340 deg) | Tropical Depression | FOURTEEN | 10/07/2018 04:53 | Berg | POINT (-86.90000 18.60000) |
#verify coordinates column is geolocation data type
type(geo_hurricane['coordinates'])
geopandas.geoseries.GeoSeries
#import file that contains a US map shape polygons
#will use to plot the coordinates of meteorite landings
filepath = "datasets/US_states(5m).json"

#data contains polygon shape coordinates for different map body types (states, etc.)
map_df = gpd.read_file(filepath)
map48 = map_df.loc[map_df['NAME'].isin(['Alaska', 'Hawaii', 'Puerto Rico']) == False]
map48.head()
| GEO_ID | STATE | NAME | LSAD | CENSUSAREA | geometry | |
|---|---|---|---|---|---|---|
| 0 | 0400000US01 | 01 | Alabama | 50645.326 | MULTIPOLYGON (((-88.12466 30.28364, -88.08681 ... | |
| 2 | 0400000US04 | 04 | Arizona | 113594.084 | POLYGON ((-112.53859 37.00067, -112.53454 37.0... | |
| 3 | 0400000US05 | 05 | Arkansas | 52035.477 | POLYGON ((-94.04296 33.01922, -94.04304 33.079... | |
| 4 | 0400000US06 | 06 | California | 155779.220 | MULTIPOLYGON (((-122.42144 37.86997, -122.4213... | |
| 5 | 0400000US08 | 08 | Colorado | 103641.888 | POLYGON ((-106.19055 40.99761, -106.06118 40.9... |
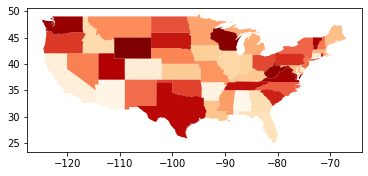
#map graph
map48.plot(cmap='OrRd')
<matplotlib.axes._subplots.AxesSubplot at 0x7fd37a3a4f50>
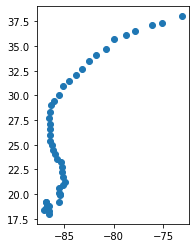
#plot the coordinates (no map)
geo_hurricane.plot()
<matplotlib.axes._subplots.AxesSubplot at 0x7fd37a8a8110>
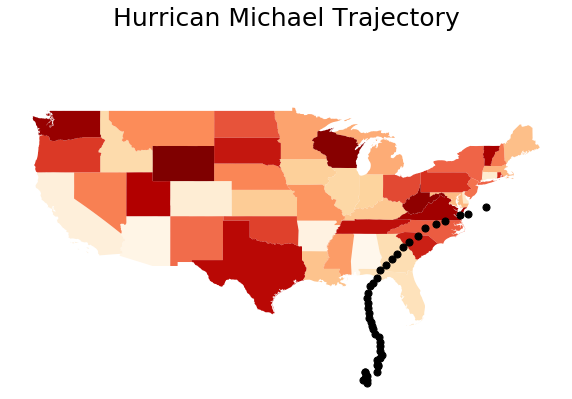
#plot coordinates on top of map graph

#this is to set the size of the borders
fig, ax = plt.subplots(1, figsize=(10,15))

#this is the map , cmap='OrRd'
basemap = map48.plot(ax=ax,  cmap='OrRd')

#plot coordinates on top of map graph
geo_hurricane.plot(ax=basemap, color='black', marker="o", markersize=50)

#take off axis numbers
ax.axis('off')

#put title on map
ax.set_ylim([17, 58])
ax.set_title("Hurrican Michael Trajectory", fontsize=25, fontweight=3)
Text(0.5, 1, 'Hurrican Michael Trajectory')
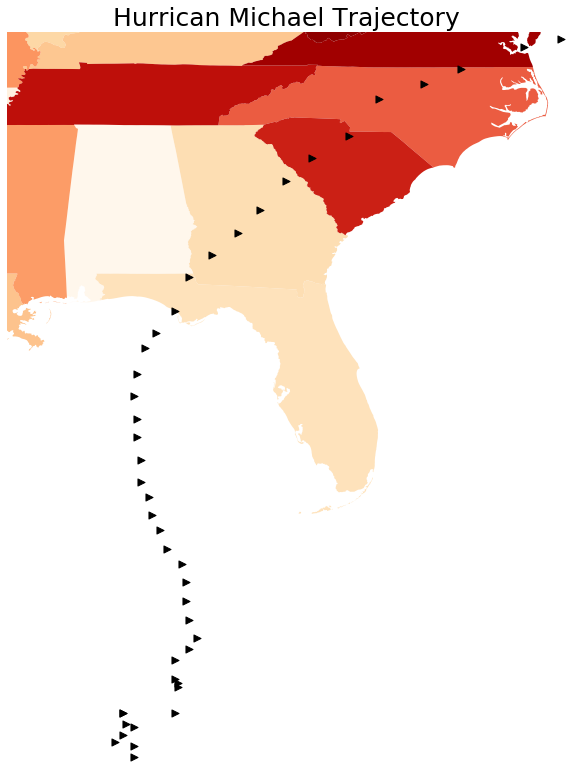
We could zoom-in and see the trajectory
#plot coordinates on top of map graph

#this is to set the size of the borders
fig, ax = plt.subplots(1, figsize=(10,15))

#this is the map , cmap='OrRd'
basemap = map48.plot(ax=ax,  cmap='OrRd')

#plot coordinates on top of map graph
geo_hurricane.plot(ax=basemap, color='black', marker=">", markersize=50)

#take off axis numbers
ax.axis('off')

#put title on map
ax.set_xlim([-90, -75])
ax.set_ylim([17.5, 37.5])
ax.set_title("Hurrican Michael Trajectory", fontsize=25, fontweight=3)
Text(0.5, 1, 'Hurrican Michael Trajectory')