Text Analysis Women Clothing
05 May 2020
Text Analysis
In this post, we will discuss how one can make sentiment analysis. Such analysis is crucial to a variety of stakeholders. It is of no surprise by now to see comments and reviews at the end of posts, online purchases, feedback for apps and/or websites. Therefore it is insightful for bloggers, online markets, app-devlopers etc to have the abilty to analyse the feedback/s they are getting from respective customers and/or users. Sentiment analysis employes techniques to interpret and classify text data as positive, negative, and neutral based on polarity. This ability to classify text data based on emotions reflected by words helps online bussiness providers improve their services and/or products.
The analysis is based on dividing paragraph, sentences into smaller units, words and based on its library assigns emotions to these unit words. Python has such library and we are going to make use of it in this post. One such library is the Natural Language Toolkit Library (NLTK). The library looks at each words and sentences in a text and cleans it unneccessary features from the text data to prepare for sentiment analysis. This. cleaning processes for example includes the exclusion of punctuation and english stop words. Without this step the text would be dominated by words like the, is, are, etc.
It is worth noting here that breaking paragraph or sentence into individualized words can be achieved by python’s builtin function .split(). We demonstrate below how to acheive it
sentence = "The quick brown fox jumps over the lazy dog!"
We now call the _.split()_ function on sentence and break down it into individualized words. In doing so we get
sentence.split()
['The', 'quick', 'brown', 'fox', 'jumps', 'over', 'the', 'lazy', 'dog!']
We also can apply the same function on a bigger text data, say the following paragraph
paragraphs = "Here we go this is my first post. Please note that I followed Jonathan McGlone steps \
to build this page. The steps provided by Jonathan McGlone, are very clearly outlined, and I say, \
in case you want to build your own website, I highly recommend implementing them faithfully. \
I have been thinking to own a page for a while, now because of COVID-19 at  last I got the courage and \
the time to putting this website together. This is hosted by Github pages, and the interesting feature  \
of it is that it is powered by Jekyll and I can use Markdown to author my posts. As Jonathan says \
It actually is a lot easier than  I thought it was going to be. I expected a lot of hurdle to build the web,\
but the steps outlined -- though I didn not completely understand what it is -- seems to be effective \
in helping me build my site."
#paragraphs.split()
Again when we implement the function it splits ‘paragraph’ into its indivisualised units. In this particular example we have long list of words, 156 to be specific. You can use the len() function to determine the length python len(paragraphs.split()). To help us visualize what we do next can be thought of as two steps. First we pass the result obtained by paragraphs.split() into a Counter that counts each key of the dictionary and returns the number of count as value. Following which we form a DataFrame, using pandas DataFrame, and put the key items of the dictionary along with thier corresponding count in. At last comes displaying the result, as we can see we have listed the top 20 words. It is interesting to see the top five words are english stop words. In fact with the exception of build, Jonathan, steps, and lot the top twenty words seem to be dominated by english stop words including punctuation, i.e ‘–’.
from pandas import DataFrame
from collections import Counter
df_dict = Counter(paragraphs.split())
#df_dict
df_counter = DataFrame(list(df_dict.items()),columns = ['words','count'])
df_counter.sort_values(by=['count'], ascending=False).reset_index().head(20)
| index | words | count | |
|---|---|---|---|
| 0 | 11 | I | 9 |
| 1 | 16 | to | 8 |
| 2 | 4 | is | 6 |
| 3 | 55 | the | 5 |
| 4 | 27 | and | 4 |
| 5 | 44 | a | 4 |
| 6 | 17 | build | 4 |
| 7 | 67 | it | 4 |
| 8 | 50 | of | 3 |
| 9 | 3 | this | 3 |
| 10 | 5 | my | 3 |
| 11 | 21 | by | 3 |
| 12 | 13 | Jonathan | 3 |
| 13 | 15 | steps | 3 |
| 14 | 34 | own | 2 |
| 15 | 90 | -- | 2 |
| 16 | 29 | in | 2 |
| 17 | 79 | lot | 2 |
| 18 | 10 | that | 2 |
| 19 | 63 | Github | 1 |
Tokenizing Words and Sentences
Above we used the .split() function to break a sentence and a paragraph apart. But python has already a neat way of spliting sentences and paragraphs into units by tokenizing them. Tokenization is the a technique by which big chunck of text is divided into its smaller units known as tokens. Doing the splitting allows us to exclude punctuations and stopwords. Ones we chopped the text data, and extracted the relevant pieces what follows is implementing sentiment analysis on the words.
Doing Sentiment analysis on text data that contains opinion help us understand how people feel about something. The VADER (Valence Aware Dictionary and sEntiment Reasoner) Sentiment Intensity Analyzer returns a score between -1 to 1. Accordingly, scores closer to -1 have a negative sentiment, scores closer to 1 have a positive sentiment, and scores around 0 are considered neutral.
First thing to do before prceeding onwards is import the necessary library and modules as follows:
import nltk
from nltk.tokenize import word_tokenize
from nltk.tokenize import sent_tokenize
from nltk.tokenize import TweetTokenizer
from nltk.probability import FreqDist
from nltk.corpus import stopwords
from nltk.stem import WordNetLemmatizer
from nltk.sentiment.vader import SentimentIntensityAnalyzer

#this is sample data
from nltk.corpus import names

from string import punctuation

#initilize function to do sentiment analysis
sid = SentimentIntensityAnalyzer()
Just in case we are interested at looking the english stop words in the ntlk.corpus library we use the stopwords.words('english'), this yields an array of words that the library considers to be stopwords.
#list of english stopwords
eng_stopwords = stopwords.words('english')
eng_stopwords
['i','me','my','myself','we', 'our', 'ours','ourselves','you',"you're", "you've", "you'll", "you'd",'your','yours',
'yourself','yourselves','he','him','his','himself','she',"she's", 'her','hers','herself','it',"it's",'its','itself',
 'they','them','their','theirs','themselves','what','which','who','whom', 'this','that',"that'll",'these','those',
 'am','is','are', 'was','were','be','been','being','have','has','had','having','do','does','did','doing','a','an',
 'the','and','but','if','or','because','as','until','while','of','at','by','for','with','about','against','between',
 'into','through','during','before','after','above','below','to','from','up','down', 'in','out','on',
 off','over','under','again','further','then','once','here','there','when',where','why','how','all','any','both',
 'each','few','more','most','other','some','such','no','nor','not','only','own','same', 'so',
 'than','too',...]
Women’s Clothing
Let us now chose a dataset to apply the analysis. We retrive a dataset, that is in a csv format, which you can download from kaggle women’s e-commerce clothing reviews. The context of the dataset is explained in kaggle as:
This is a Women’s Clothing E-Commerce dataset revolving around the reviews written by customers. Its nine supportive features offer a great environment to parse out the text through its multiple dimensions. Because this is real commercial data, it has been anonymized, and references to the company in the review text and body have been replaced with “retailer”.
The target is to analyse the reviews, we achieve this by creating a function that will analyze the “Review Text” column and calculate the corresponding sentiment value. We create a new column in the dataframe in which we will put the sentiment value for each review.
First thing first, let us read our file and make sure it is clean and in a desired format. I already downloaded the csv file entitled women_clothing_review.csv into my dataset folder. To open the file and read it we need to import pandas library.
import pandas as pd

#load the data from the Reviews.csv file
filepath = "datasets/women_clothing_review.csv"
df = pd.read_csv(filepath, encoding = "latin-1") #this file is encoded differently

df.head()
| Unnamed: 0 | Clothing ID | Age | Title | Review Text | Rating | Recommended IND | Positive Feedback Count | Division Name | Department Name | Class Name | |
|---|---|---|---|---|---|---|---|---|---|---|---|
| 0 | 0 | 767 | 33 | NaN | Absolutely wonderful - silky and sexy and comf... | 4 | 1 | 0 | Initmates | Intimate | Intimates |
| 1 | 1 | 1080 | 34 | NaN | Love this dress! it's sooo pretty. i happene... | 5 | 1 | 4 | General | Dresses | Dresses |
| 2 | 2 | 1077 | 60 | Some major design flaws | I had such high hopes for this dress and reall... | 3 | 0 | 0 | General | Dresses | Dresses |
| 3 | 3 | 1049 | 50 | My favorite buy! | I love, love, love this jumpsuit. it's fun, fl... | 5 | 1 | 0 | General Petite | Bottoms | Pants |
| 4 | 4 | 847 | 47 | Flattering shirt | This shirt is very flattering to all due to th... | 5 | 1 | 6 | General | Tops | Blouses |
We point out here that as the file is encoded some how differently we enforce encoding = "latin-1" to help us open and read it properly. The next thing we should do is make sure the data frame doesn’t have a sizeable amount of NaN or null values. Specially the column we are interested, i.e Review Text, in must be checked before proceeding to make analysis.
df.isnull().mean()*100
Unnamed: 0                  0.000000
Clothing ID                 0.000000
Age                         0.000000
Title                      16.222430
Review Text                 3.597888
Rating                      0.000000
Recommended IND             0.000000
Positive Feedback Count     0.000000
Division Name               0.059610
Department Name             0.059610
Class Name                  0.059610
dtype: float64
As you can see about 3.6% of the entries in column that is of interest to us is missing, as there is no way of replacing these missing values even with less accuracy, we decide to drop these missing values. This is done by the following line of code.
df.dropna(inplace=True)
df.reset_index(drop=True)
| Unnamed: 0 | Clothing ID | Age | Title | Review Text | Rating | Recommended IND | Positive Feedback Count | Division Name | Department Name | Class Name | |
|---|---|---|---|---|---|---|---|---|---|---|---|
| 0 | 2 | 1077 | 60 | Some major design flaws | I had such high hopes for this dress and reall... | 3 | 0 | 0 | General | Dresses | Dresses |
| 1 | 3 | 1049 | 50 | My favorite buy! | I love, love, love this jumpsuit. it's fun, fl... | 5 | 1 | 0 | General Petite | Bottoms | Pants |
| 2 | 4 | 847 | 47 | Flattering shirt | This shirt is very flattering to all due to th... | 5 | 1 | 6 | General | Tops | Blouses |
| 3 | 5 | 1080 | 49 | Not for the very petite | I love tracy reese dresses, but this one is no... | 2 | 0 | 4 | General | Dresses | Dresses |
| 4 | 6 | 858 | 39 | Cagrcoal shimmer fun | I aded this in my basket at hte last mintue to... | 5 | 1 | 1 | General Petite | Tops | Knits |
| ... | ... | ... | ... | ... | ... | ... | ... | ... | ... | ... | ... |
| 19657 | 23481 | 1104 | 34 | Great dress for many occasions | I was very happy to snag this dress at such a ... | 5 | 1 | 0 | General Petite | Dresses | Dresses |
| 19658 | 23482 | 862 | 48 | Wish it was made of cotton | It reminds me of maternity clothes. soft, stre... | 3 | 1 | 0 | General Petite | Tops | Knits |
| 19659 | 23483 | 1104 | 31 | Cute, but see through | This fit well, but the top was very see throug... | 3 | 0 | 1 | General Petite | Dresses | Dresses |
| 19660 | 23484 | 1084 | 28 | Very cute dress, perfect for summer parties an... | I bought this dress for a wedding i have this ... | 3 | 1 | 2 | General | Dresses | Dresses |
| 19661 | 23485 | 1104 | 52 | Please make more like this one! | This dress in a lovely platinum is feminine an... | 5 | 1 | 22 | General Petite | Dresses | Dresses |
19662 rows × 11 columns
df.isnull().sum()
Unnamed: 0                 0
Clothing ID                0
Age                        0
Title                      0
Review Text                0
Rating                     0
Recommended IND            0
Positive Feedback Count    0
Division Name              0
Department Name            0
Class Name                 0
dtype: int64
Now that our data is clean and ready for analysis, let us build a function that cleans the reviews, that are in our Review Text column. To begin with we make every word be in lower case, following which we break the reviews into individualized form. After breaking the text into bits of words, we then remove punctuations and english stopwords from the tokenized format. Next is to collect the remaining tokenized words into a list for further use. Once we gather these individualized words, what follows is to form back the reviews in a sentences or paragraph form (without the punctuations and stopwords that is). At last we calculate the sentiment polarity and return the sentiment value for each review. What follows is a function that can implement all these processes outlined.
#create a function to clean up each review
#then it will analyze and assign a sentiment polarity
def reviewSentiment(review):

    #make text lowercase
    review = review.lower()

    #tokenize the review
    #tknz_review is alist
    tknz_review = word_tokenize(review)

    #remove puntuation
    for token in tknz_review:
        if token in punctuation:
            tknz_review.remove(token)

    #empty list to hold "cleaned" tokens
    clean_tokens = []

    #remove filler words
    for token in tknz_review:
        if token not in eng_stopwords:
            clean_tokens.append(token)

    #put sentence back together with remaining clean words
    clean_review = ' '.join(clean_tokens)

    #get the polarity scores dictionary
    sid_rev = sid.polarity_scores(clean_review)

    #get sentiment polarity from the "compound" key in the sid_rev dictionary
    r_comp = sid_rev['compound']

    #return the sentiment value
    return r_comp
As our interest is to apply the above function for each review and obtaing the corresponding sentiment value, it requires that we create a column to put the sentimnet values for each review. Let us name the new column review_sentiment. We see below the newly formed column in the dataframe.
#create a new column to hold sentiment value from function
df['review_sentiment'] = df['Review Text'].apply(reviewSentiment)
#erify sentiment values in new column
df.head()
| Unnamed: 0 | Clothing ID | Age | Title | Review Text | Rating | Recommended IND | Positive Feedback Count | Division Name | Department Name | Class Name | review_sentiment | |
|---|---|---|---|---|---|---|---|---|---|---|---|---|
| 2 | 2 | 1077 | 60 | Some major design flaws | I had such high hopes for this dress and reall... | 3 | 0 | 0 | General | Dresses | Dresses | 0.9062 |
| 3 | 3 | 1049 | 50 | My favorite buy! | I love, love, love this jumpsuit. it's fun, fl... | 5 | 1 | 0 | General Petite | Bottoms | Pants | 0.9464 |
| 4 | 4 | 847 | 47 | Flattering shirt | This shirt is very flattering to all due to th... | 5 | 1 | 6 | General | Tops | Blouses | 0.9117 |
| 5 | 5 | 1080 | 49 | Not for the very petite | I love tracy reese dresses, but this one is no... | 2 | 0 | 4 | General | Dresses | Dresses | 0.9153 |
| 6 | 6 | 858 | 39 | Cagrcoal shimmer fun | I aded this in my basket at hte last mintue to... | 5 | 1 | 1 | General Petite | Tops | Knits | 0.6361 |
df.dtypes
Unnamed: 0                   int64
Clothing ID                  int64
Age                          int64
Title                       object
Review Text                 object
Rating                       int64
Recommended IND              int64
Positive Feedback Count      int64
Division Name               object
Department Name             object
Class Name                  object
review_sentiment           float64
dtype: object
Although getting sentiment value is a step in the right direction, that in itself is not that much infromative. To paint a clear picture we need to chnage the category into numerics using the following function. The function help us chnage the numbers into positive, negative, and neutral categories. We indicate the categories by creating another column to indicate the category.
#create a function to assign a polarity category to the sentiment
def sentimentCategory(sent_num):
    if sent_num >= 0.2:
        return "positive"
    if sent_num <= -0.2:
        return "negative"
    else:
        return "neutral"
#create a new column to hold sentiment category
df['sentiment_category'] = df['review_sentiment'].apply(sentimentCategory)
For the purpose of this post our interest lies in analysing the reviews, and the relevant columns as far as we are concerned can then be extracted to establish a new DataFrame that consists of these relevant columns. The following code line takes care of that. It is worth noting here that we need to reset index as we will use index to show case the reviews in each category.
df = df[['Review Text','review_sentiment','sentiment_category']]
df = df.reset_index(drop=True)
df.head(5)
| Review Text | review_sentiment | sentiment_category | |
|---|---|---|---|
| 0 | I had such high hopes for this dress and reall... | 0.9062 | positive |
| 1 | I love, love, love this jumpsuit. it's fun, fl... | 0.9464 | positive |
| 2 | This shirt is very flattering to all due to th... | 0.9117 | positive |
| 3 | I love tracy reese dresses, but this one is no... | 0.9153 | positive |
| 4 | I aded this in my basket at hte last mintue to... | 0.6361 | positive |
Looking at the above table, one might wonder if every review is categorized as positive, to check that doubt we now categorize the dataFrame based on category and request to get value counts for each category. In doing so we note that, see below, majority of the reviews are categorized as postive.
#compare frequency of positive, negative, and neutral reviews
df['sentiment_category'].value_counts()
positive    18596
neutral       614
negative      452
Name: sentiment_category, dtype: int64
Let us peek in at each category, within our data, by extracting entries that fullfills the condition that we are looking for. By this what we mean is that let us collect entries from df, that satisfies the condition
df['sentiment_category']== 'positive' | 'negative' | 'neutral'
The results respectively are seen in the followng three consecutive tables.
df[df['sentiment_category']== 'positive'].head(3)
| Review Text | review_sentiment | sentiment_category | |
|---|---|---|---|
| 0 | I had such high hopes for this dress and reall... | 0.9062 | positive |
| 1 | I love, love, love this jumpsuit. it's fun, fl... | 0.9464 | positive |
| 2 | This shirt is very flattering to all due to th... | 0.9117 | positive |
df[df['sentiment_category']== 'negative'].head(3)
| Review Text | review_sentiment | sentiment_category | |
|---|---|---|---|
| 60 | The zipper broke on this piece the first time ... | -0.2263 | negative |
| 79 | The fabric felt cheap and i didn't find it to ... | -0.3724 | negative |
| 84 | This is so thin and poor quality. especially f... | -0.3892 | negative |
df[df['sentiment_category']== 'neutral'].head(5)
| Review Text | review_sentiment | sentiment_category | |
|---|---|---|---|
| 19 | First of all, this is not pullover styling. th... | 0.1027 | neutral |
| 76 | At first i wasn't sure about it. the neckline ... | 0.1106 | neutral |
| 159 | Nice weight sweater that allows one to wear le... | 0.1999 | neutral |
| 160 | I loved this top; it reminded me of one i have... | 0.0258 | neutral |
| 235 | I wore this dress for the first time yesterday... | 0.1882 | neutral |
It is note worthy mentioning here that instead of listing df’s entries by querying a specific condition as we just did, we can alternatively use the following line of code to extract the indices of the entries we are interested in, and use the index inturn to get the exact entry by using index position:
df.index[df['sentiment_category'] == 'neutral'].tolist()
Let us now see one review entry from each category along with their sentiment value and allocated category.
Positive
df['Review Text'].iloc[0]
'I had such high hopes for this dress and really wanted it to work for me.
i initially ordered the petite small (my usual size) but i found this to be outrageously small.
so small in fact that i could not zip it up! i reordered it in petite medium, which was just ok.
overall, the top half was comfortable and fit nicely, but the bottom half had a very tight under
layer and several somewhat cheap (net) over layers. imo, a major design flaw was the net over layer
sewn directly into the zipper - it c'
df['review_sentiment'].iloc[0]
0.9062
df['sentiment_category'].iloc[0]
'positive'
It is interesting to note here that, although reading the review doesn’t imply that the review is by and large positive we can see that it is categorized as postive with a very high value, i.e 0.9
Nagative
df['Review Text'].iloc[79]
"The fabric felt cheap and i didn't find it to be a flattering top. for reference i am wearing a medium in
the photos and my measurements are 38-30-40."
df['review_sentiment'].iloc[79]
-0.3724
df['sentiment_category'].iloc[79]
'negative'
Here our judgement and sentiment-analysis’s conclusion seems to be aligned
Neutral
df['Review Text'].iloc[19]
"First of all, this is not pullover styling. there is a side zipper. i wouldn't have purchased it
if i knew there was a side zipper because i have a large bust and side zippers are next to impossible
for me.\n\nsecond of all, the tulle feels and looks cheap and the slip has an awkward tight shape underneath.
\n\nnot at all what is looks like or is described as. sadly will be returning, but i'm sure i will find
something to exchange it for!"
df['review_sentiment'].iloc[19]
0.1027
df['sentiment_category'].iloc[19]
'neutral'
In this particular case also our conclusion and the analysis’s verdict diverges, we would get a negative feel from comment. The reviewer seems to be telling us that she is tricked into buying the dress. Reading the comment we would take it as a negative review, yet the analysis thinks it is neutral
Contradictory?
df['Review Text'].iloc[24]
"The colors weren't what i expected either. the dark blue is much more vibrant and i just couldn't find anything to really go with it. fabric is thick and good quality. has nice weight and movement to it. the skirt just wasn't for me, in the end."
df['review_sentiment'].iloc[24]
0.8442
df['sentiment_category'].iloc[24]
'positive'
Although this may not as be straight forward as the previous cases, the overall vibe of the comment is inclined towards negative than postive. One would have put this as neutral, taking into cosideration the mixed message sengt by the comment
Visualizing Sentiments
Whenever it is possible it is a good practice to include visual presentation while sharing your work. To this end we here visualize the categories using pie chart. Generally speaking it is not advisable to use pie-charts if you have more than forur items in category, as it could bring (at times) difficultly in telling the difference between the size of the slices in the chart. A very promising and appealing visual display is given below, it is one of my favorites when you have fewer categories to compare. This visual fihure is a variant of pie-chart and is commonly known as donut-like pie chart.
In the following code cell the magic line %matplotlib inline ensures that the images to be displayed in this notebook. The semicolon (;) at the end of the plot command avoids the display of <matplotlib.axes._subplots.AxesSubplot at 0x1a1ec10290> in the output.
%matplotlib inline
df.groupby(['sentiment_category']).size().plot.pie(label="");
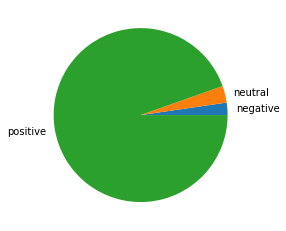
As we can see from the pie chart the majority of the reviews are categorized to be postive. Set aside as to the resason why we got such large proportion of postive category as it is not the the scope of the present post. But it is worth pointing out that the analysis needs further refining. This could be related because of the limitation of the function to anlayse words like wouldn't, couldn't, isn't and the likes.
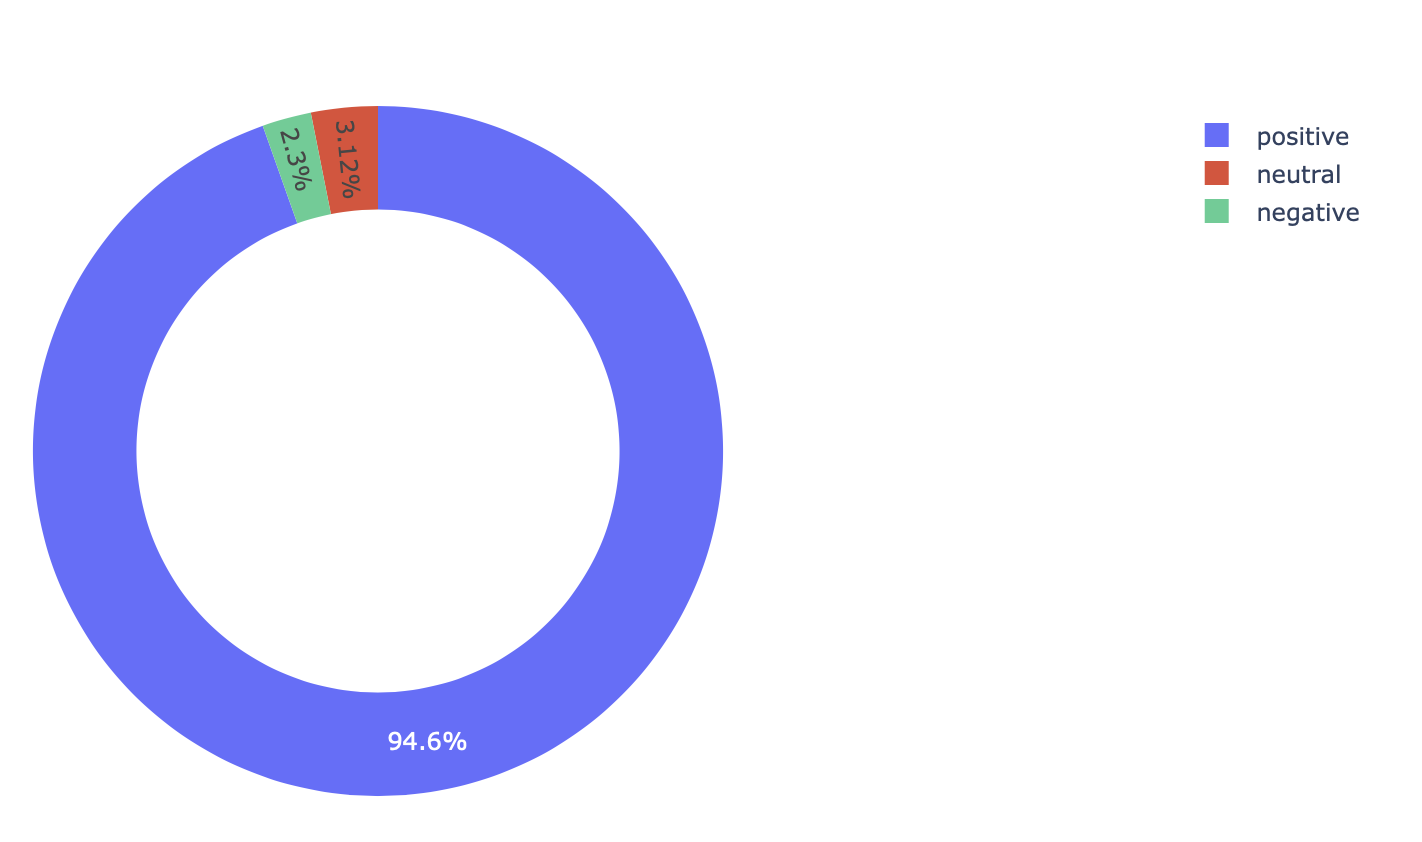
Another point worth raising here that from the look of it the proportions of neutral and negative are close enough it is hard to see the difference from the graph. A best solution in such case is to include percentage value alongside the chart. One of the ways to achieve this leads me to introduce my preference when it comes to versions of pie-charts. Instead of pie chart, I think donut-like pie chart is visually more attractive, you can find it and other interesting, visually appealing pie-charts that uses Python’s Plotly in donut-pie.
import plotly.graph_objects as go
%matplotlib inline


df_sentiments = df.groupby('sentiment_category').size()/df['sentiment_category'].count()*100
labels = df_sentiments.index
values = df_sentiments.values

# Use `hole` to create a donut-like pie chart
fig = go.Figure(data=[go.Pie(labels=labels, values=values, hole=.7)])
fig.show()
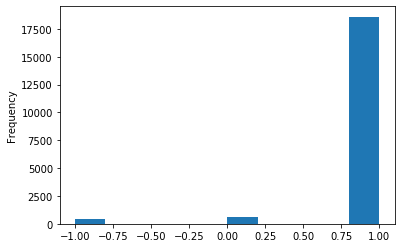
To get clear picture of the neutral and negative catagories let us make a histogram plot. To do so we need to convert the categories into numbers using the following function. Where we assigned positive =1, negative =-1, and neutral = 0.
#create a function to assign a number to category of the sentiments
def sentimentCategory_num(sent_num):
    if sent_num == "positive":
        return 1
    if sent_num == "negative":
        return -1
    else:
        return 0
#create a new column to hold sentiment category numbers
df['sentiment_category_num'] = df['sentiment_category'].apply(sentimentCategory_num)
df['sentiment_category_num'].plot(kind='hist');
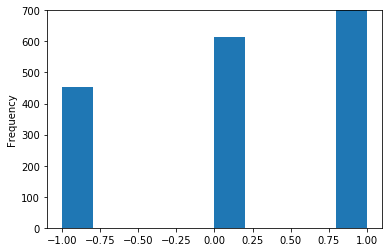
# zoom_in plots
df['sentiment_category_num'].plot(kind='hist', ylim=(0,700));
Overall, it seems that most buyers feel positive.